In a nutshell: A crypto trading chart shows how a coin’s price moved over time. Most traders use candlestick charts, where each candle shows four prices for one time period: the open, high, low and close. Green candles closed higher than they opened, red candles closed lower. Volume bars show how much traded, and tools like support and resistance, moving averages and RSI help describe what already happened. Charts only show the past. They cannot predict the future, and crypto is very volatile. Educational only; not financial advice.
Last updated: October 21, 2026.
Open any exchange or price site and the first thing you see is a crypto trading chart: rows of little green and red bars, a strip of volume at the bottom and, often, a few colored lines on top. It looks complicated, but it is built from a handful of simple ideas.
This guide explains how to read a chart from scratch: candlesticks, timeframes, volume, support and resistance, moving averages and RSI. It also covers what charts cannot tell you, because that part matters just as much.
Table of contents
- What is a crypto trading chart?
- Line, bar and candlestick charts
- How to read a candlestick
- Timeframes: 1 minute to 1 week
- Volume: how much actually traded
- Support and resistance
- Moving averages
- RSI (relative strength index)
- Putting it together: a simple example
- What charts can’t tell you
- Common beginner mistakes
- FAQ
What Is a Crypto Trading Chart?
A crypto trading chart plots a coin’s price on the vertical axis against time on the horizontal axis. You will usually see it paired with a trading pair, such as BTC/USD (the price of one bitcoin in US dollars) or ETH/USDT (the price of one ether in the Tether stablecoin).
Reading charts is part of what’s called technical analysis. Investopedia’s overview of technical analysis describes it as studying past market data, mainly price and volume, and adds an important caveat: past performance does not guarantee future results. Keep that sentence in mind for the rest of this guide.
On an exchange, the chart usually sits next to the order book, where live buy and sell orders are listed. If bids, asks and spreads are new to you, our guide to spot trading and the order book covers them first.
Line, Bar and Candlestick Charts
Most charting screens let you switch between three main styles:
- Line chart: one line joining the closing price of each period. Clean and simple, good for seeing the big picture, but it hides how far price swung inside each period.
- Bar (OHLC) chart: each period is a vertical bar with small ticks for the open and close. Investopedia’s OHLC chart explainer notes that it shows the open, high, low and close for each period.
- Candlestick chart: the same four prices drawn as a colored “candle.” This is the default on most crypto exchanges and the one this guide focuses on.
How to Read a Candlestick
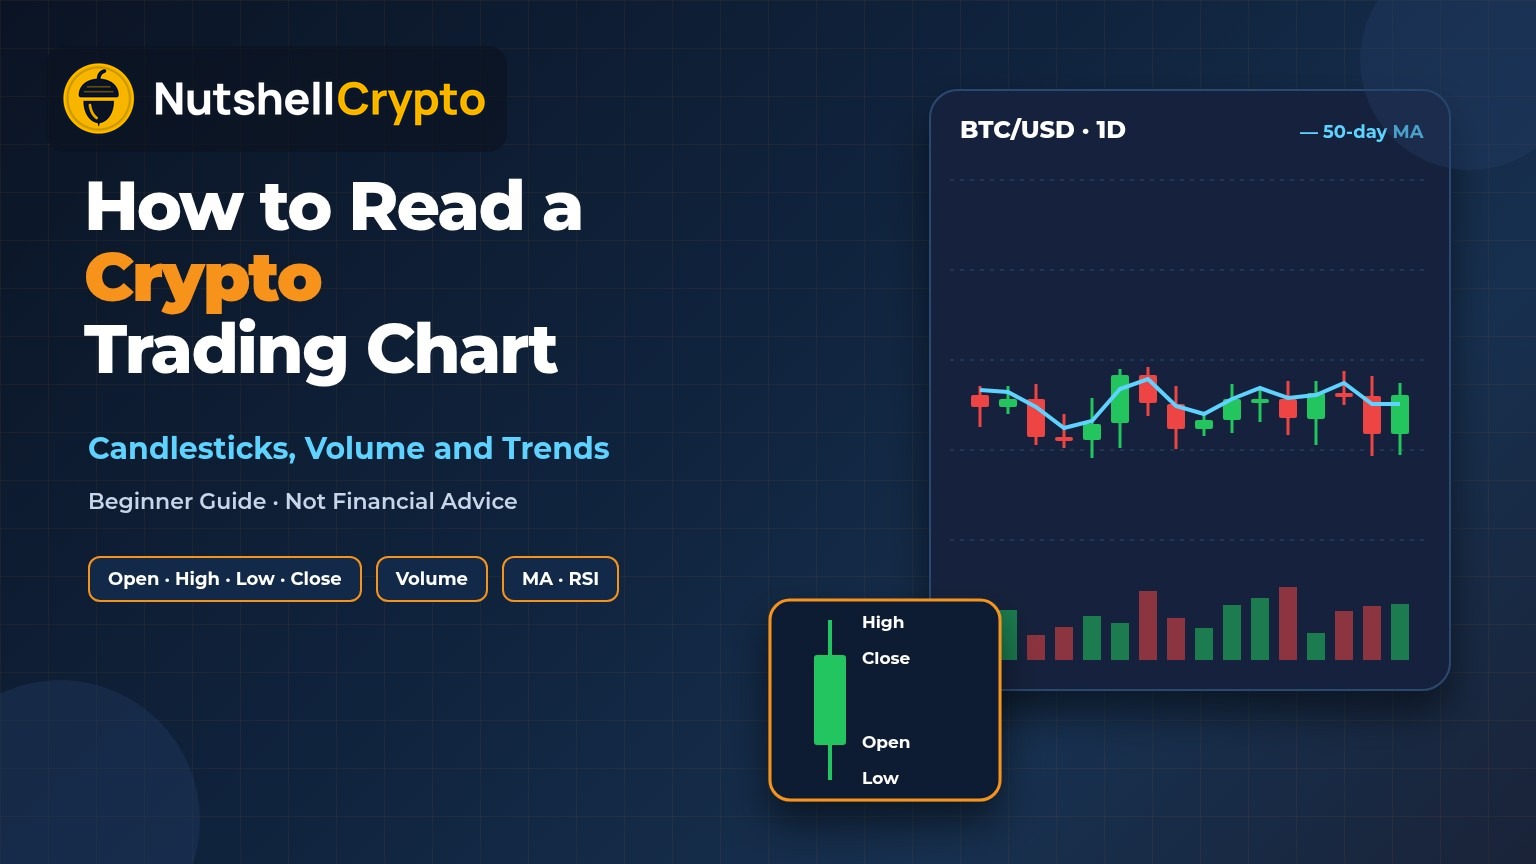
Each candle covers one period of time, for example one hour or one day. According to Investopedia’s candlestick definition, a candle shows the opening, closing, high and low prices for that timeframe, and the method itself goes back to a technique developed in Japan in the 1700s for tracking the price of rice.
A candle has two parts:
- The body (the thick part) runs between the open and the close. Investopedia calls it the “real body.” It is green (or white) when the close was higher than the open, and red (or black) when the close was lower.
- The wicks (also called shadows) are the thin lines above and below the body. The top of the upper wick is the period’s high, and the bottom of the lower wick is the period’s low.
| What you see | What it means |
|---|---|
| Tall green body, short wicks | Price rose steadily from open to close during that period. |
| Tall red body, short wicks | Price fell steadily from open to close. |
| Small body, long wicks on both sides | Price swung a lot but ended close to where it started. Buyers and sellers were roughly balanced. |
| Long lower wick | Price dropped during the period but recovered before the close. |
| Long upper wick | Price rose during the period but gave back much of the gain. |
Investopedia’s guide to candlestick charting goes through named patterns such as dojis and engulfing candles. You don’t need to memorize them to read a chart. Start with the body and wicks, and you already understand most of what a candle is telling you.
A crypto-specific detail: stock markets open and close each day, but crypto trades around the clock. A “daily” candle on a crypto exchange simply starts and ends at a fixed clock time the platform chooses, so two sites can show slightly different daily candles for the same coin. Check the time zone setting on your chart.
Timeframes: 1 Minute to 1 Week
The timeframe sets how much time each candle covers. Common choices are 1 minute, 15 minutes, 1 hour, 4 hours, 1 day and 1 week.
- Short timeframes (minutes) show a lot of noise. Small, random moves look dramatic.
- Long timeframes (daily, weekly) smooth out the noise and show the broader trend.
The same coin can look like it is crashing on a 5-minute chart and climbing on a weekly chart at the same moment. Before you react to any chart, check which timeframe you are looking at. Long-term buyers who use a fixed schedule, such as dollar cost averaging into crypto, often skip short-term charts entirely.
Volume: How Much Actually Traded
The bars along the bottom of most charts show trading volume: how much of the coin changed hands in each period. Investopedia’s volume explainer says high trading volume generally points to an active market with better liquidity, and that technical analysts use volume to judge how strong a price move is.
In plain terms:
- A big price move on high volume means many traders took part.
- A big move on very low volume can reverse easily, because only a few orders pushed the price.
One caution for crypto: an exchange’s chart shows the volume on that exchange only, not the whole market. Price sites that combine many exchanges, such as CoinGecko’s Bitcoin page, give a wider view. Small coins listed on only one or two platforms can have thin, easily moved volume.
Support and Resistance
Support is a price area where a falling price has tended to stop and bounce. Resistance is an area where a rising price has tended to stall. Investopedia’s support level guide describes support as the point where price tends to stop falling because of buyer interest, and says traders often think of it as a band rather than one exact line.
You can spot these areas by looking for prices the chart has touched several times. Round numbers, like a coin hitting an even $1 or $100, often act this way too, simply because many people place orders there.
Support and resistance are not walls. When a level breaks, price can move quickly through it. That is one reason leveraged traders get hurt: a break below a level can trigger a wave of forced selling, which our guide to liquidation in crypto explains.
Moving Averages
A moving average (MA) is a line showing the average closing price over the last set number of periods. Investopedia’s moving average explainer lists two main types:
- Simple moving average (SMA): a plain average of the last set number of closing prices.
- Exponential moving average (EMA): gives more weight to recent prices, so it reacts faster.
The same source notes that the 50-day and 200-day moving averages are widely followed, and that moving averages are “lagging” because they are built from past prices. The longer the period, the bigger the lag.
How beginners usually read them: price above a rising moving average suggests an uptrend so far, and price below a falling one suggests a downtrend so far. Note the words “so far.” A moving average describes the past; it does not forecast.
RSI (Relative Strength Index)
The RSI is a line usually drawn in a separate panel under the chart, on a scale from 0 to 100. Investopedia’s RSI guide says it was introduced in 1978, is usually calculated over 14 periods, and that an asset is commonly considered “overbought” above 70 and “oversold” below 30. The same guide notes RSI works best in sideways, range-bound markets rather than strong trends.
In crypto, coins can stay above 70 or below 30 for long stretches during big moves. “Overbought” does not mean “about to fall,” and “oversold” does not mean “about to rise.”
Putting It Together: A Simple Example
Here is how a beginner might read a daily Bitcoin chart. The numbers below are made-up example figures, not real prices.
- Set the timeframe to 1 day so each candle is one day.
- Look at the last few candles. Suppose three red candles in a row, each closing lower, with the last one showing a long lower wick. That says price fell for three days, and on the last day it dipped further but recovered part of the drop before the close.
- Check volume. If the red days had higher volume than usual, many traders were selling, not just a few.
- Find nearby levels. Suppose the price is near an example level of $60,000 that it bounced from twice in the past few months. That is a support area worth noting, and a natural level for one of your crypto price alerts.
- Glance at the moving average and RSI. Price below a falling 50-day MA and an RSI near 30 describe a downtrend that has been strong recently.
What this reading gives you is a description: “Bitcoin has fallen for three days on rising volume and is near a level that held before.” It does not tell you what happens next. Price could bounce, move sideways, or break the level and fall further.
What Charts Can’t Tell You
- The future. Every tool above is built from past prices.
- News and fundamentals. A hack, a regulatory action, a token unlock or a large holder selling can move price regardless of what the chart showed a minute earlier.
- The true risk. The CFTC’s guide to the risks of virtual currency points out that crypto values come only from supply and demand and are more volatile than traditional currencies, and that losses are amplified when you trade with leverage.
- Whether the volume is real. On small, thinly traded coins, a few accounts can move a chart a long way. Be extra careful with sudden spikes on obscure tokens.
Common Beginner Mistakes
- Trading off one candle. A single green or red candle on a short timeframe is mostly noise.
- Stacking too many indicators. Ten lines on a chart usually add confusion, not clarity.
- Treating patterns as promises. Patterns describe what often happened before, not what must happen next.
- Adding leverage because the chart “looks certain.” No chart is certain. If you are considering borrowed money, read our explainer on margin trading costs and risks first.
- Paying for “signal” groups. Paid chat groups that promise sure-win chart signals are a common scam pattern. Nobody can reliably call crypto prices.
- Ignoring fees. Frequent trading off short-term charts adds up in trading fees and, in the US and Canada, can create many taxable events.
FAQ
What is the best timeframe for a crypto trading chart?
There is no single best one. Daily and weekly charts show the bigger trend with less noise, which suits most beginners. Minute charts show very short-term moves and a lot of noise.
What do green and red candles mean?
Green means the period closed higher than it opened. Red means it closed lower. The thin wicks show the highest and lowest prices during that period.
Can you predict crypto prices with charts?
No. Charts describe past price and volume. Some traders use them to plan entries, exits and stop-losses, but no chart tool can reliably predict where price goes next.
Where can I see a crypto chart for free?
Most exchanges and price-tracking sites show free candlestick charts with volume, moving averages and RSI. Aggregator sites that combine many exchanges give a broader view than a single exchange’s chart.
Is RSI above 70 a sell signal?
Not on its own. Above 70 is commonly called “overbought,” but in strong crypto trends RSI can stay high for a long time while price keeps rising.
This article is for education only and is not financial, investment or tax advice. Crypto is highly volatile and you can lose money.